
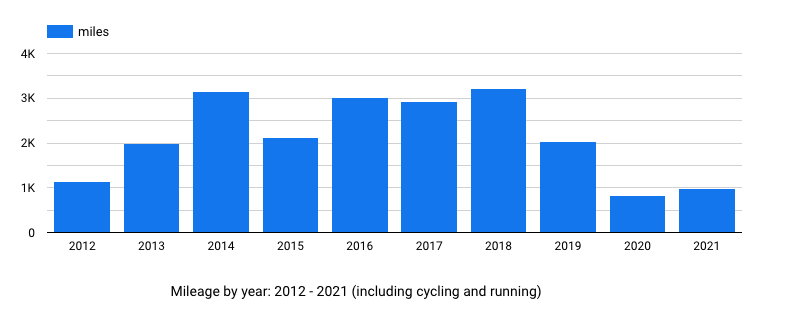
How has my combined mileage changed over the years? I did some digging in Strava to find out what my cycling and running mileage has looked like over time. These charts are from the last 10 years. * I can’t believe I’ve been using Strava for 10 years, but that’s another post.
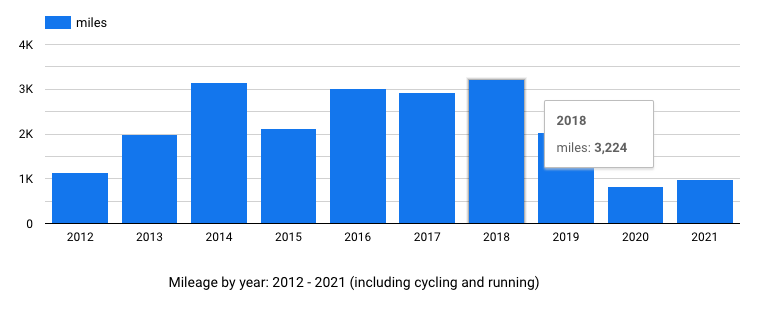
My highest volume training year was 2018 (2nd chart), my lowest was 2012 (3rd chart). The lowest year was most likely because I wasn’t recording all my activities, and I probably wasn’t running very much. I’m not sure about 2018. I would have thought it would have been 2016, when I ran Mountain Lakes 100 and my overall volume was high.
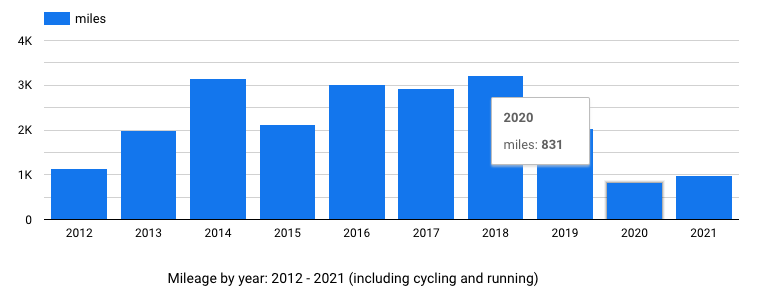
2015 – 2018 were pretty consistent, but I started to fall off the volume in 2019, and nose-dived in 2020. Cloudability had just been acquired acquired and I started going into the office less (no 10 mile round trip bike commute) and less frequent lunch time runs. I think I was just working a lot in 2019 before Covid. I has my last flight to Seattle in March, when Covid started to appear more frequently in the news – I think everything shut down a few weeks later. I can’t believe I was traveling through SeaTac maskless with people coughing all around. Holy shit. I took over leadership of a much larger team in 2019 and was just generally working a lot (remotely). My training volume suffered.
I mentioned in a previous post that I’ve started riding the smart trainer – only 2 rides so far, but I’m planning to use it to build a base going into the spring. I think I can recapture some of the lost commute miles – even if I only ride 45 minutes per day, that would make up the deficit from 2019 and 2020.
I’m going to proceed cautiously, doing 1 hour rides 3-4 hours / week and then take a functional threshold power (FTP) test in 2 weeks, this will give me a baseline for training. I don’t really want to know max output right now, I just want to get comfortable riding and using the apps (currently Rouvy). Though it was fun cranking up to 300 watts plus just because I wanted to see the number go up.
I rode an hour last night and found it … not bad … I ran a 5 miler this morning and my legs felt the accumulated cycling + running. Tired legs.
To make the charts above, I cut/pasted data from Strava into Google Sheets, then pasted the URL into Google Data Studio, then pulled some levers and turned some dials. I’m not sure if you can extract all your data from Strava – I know you can download .gpx data – but maybe not cumulative reporting data.
Leave a Reply